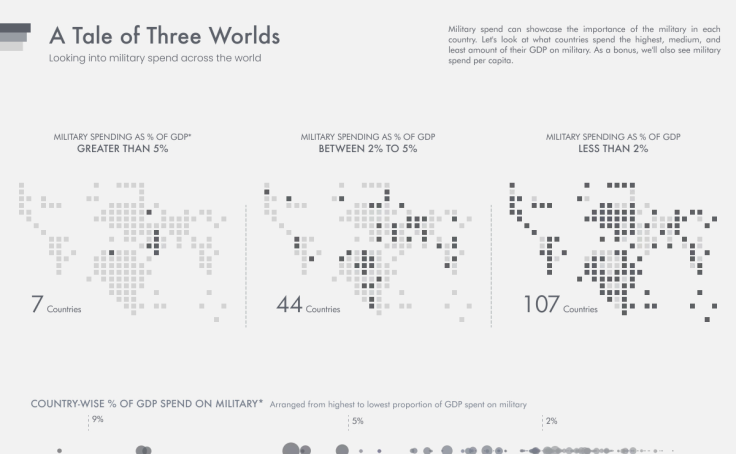
Varun Jain is a Business Intelligence Analyst at Ledger, based in Paris, and a two-time Tableau Public Ambassador with seven #VizOfTheDay picks. "Tableau is my creative outlet," he writes on his profile, and his portfolio moves easily between product dashboards and stories about the world.
His work in data
Varun was a Tableau Public Featured Author in 2022 and runner-up for the APAC region in the 2023 Iron Viz qualifiers, when he had only been using Tableau for about a year and a half. At the time he was a Data Analyst and Tableau Developer at Binance.US. He entered Iron Viz again in 2026 with "What's for Dinner Tonight?", and his Tableau Public profile also lists a Master's at ESSEC Business School.
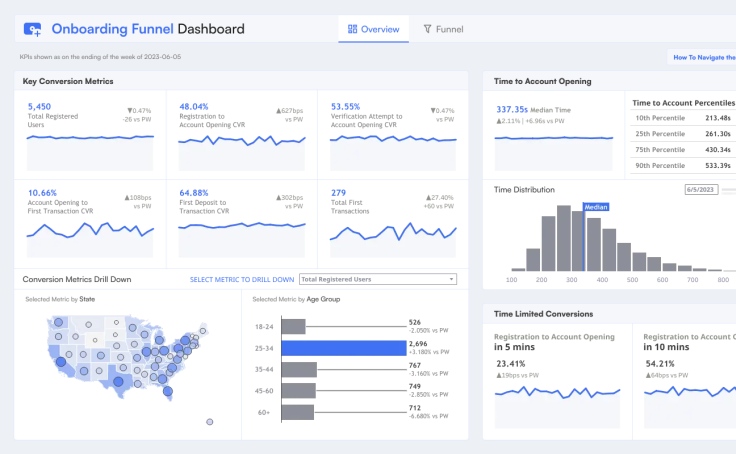
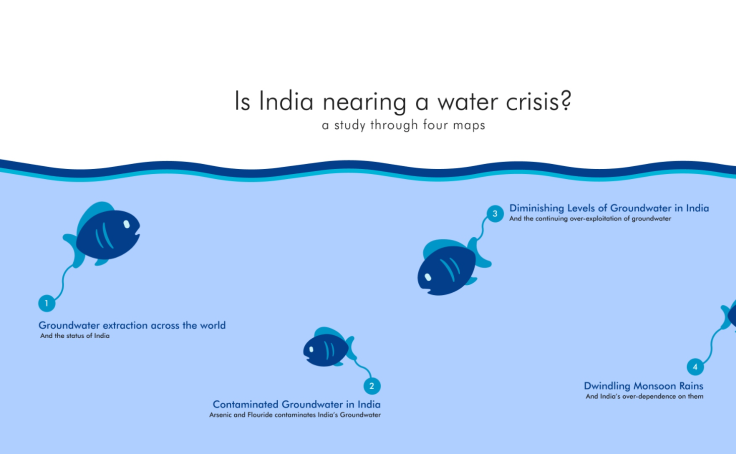
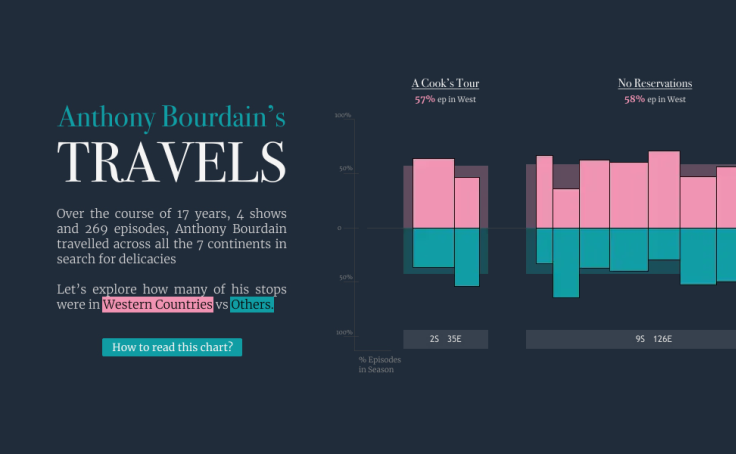
His Viz of the Day picks stretch from an astronomy calendar to Anthony Bourdain's travels, which maps 17 years, four shows and 269 episodes. His User Onboarding Funnel Dashboard is his most viewed, with more than 80,000 views, and his Viz for Social Good projects, including one on India's groundwater, have put his skills to work for NGOs.
He writes about data visualisation on his blog, Three Way Join, and is listed as a creator on Visual Capitalist.
His session with Kenya TUG
Varun joined us in April 2026 for "Beyond Charts", a session on one of the most underrated skills in Tableau: building high-impact tables. Most tables fail, the session argued, not because of the data but because of how it's presented.
He covered when to use tables instead of charts, how to turn a flat data grid into a polished dashboard component and how to make a table tell a story. There were plenty of "I didn't know you could do that" moments, and his workbook from the session is linked below so you can try the techniques yourself.